Machine Learning Capabilities with Oracle Analytics Cloud
The latest version of Oracle Data Visualization (v4.0) introduces a machine learning feature that lets users to build and make predictions using your existing data.
These models are classified like
·
Numeric
Prediction (Numeric Prediction against new data)
·
Classification
(Prediction against new data, Classification/labels are known)
·
Clustering (understand
the structure of the data without a known classification Oracle DV
offers several ML algorithms to support various versions (Numeric prediction.
Multi Classification, two classification and clustering).

Typical Workflow to Analyse Data with Machine Learning in
Oracle DV

Train
Numeric Prediction: Apply this model to you are data to predict a numeric
value based on the known data values. Train numeric prediction node considers
all input columns in the data set, but
built the model only using columns which it find to have a decisive influence
on determining the target value.
Example: You might predict CPU performance.
We train binary classification using the
train Numeric prediction step by step:
è
Create or open data flow.
è
Click on add step (+), then click on Train
Binary Classification.
è
In the select Train Numeric Prediction model
script dialog, select script
1.
CART
(Classification and Regression Tree) for model training: Uses decision tree
to predict both discrete and continue values. It can be used when working with
large data sets.
2.
Elastic
net linear regression for model training: It is an advanced regression method.
It does regularisation (adds additional information), variable section and
linearly combines penalties lasso and ridge regression method. This is useful
in cases with large number of attributes to avoid collinearity (multiple
attributes being perfectly correlated) and over fitting.
3.
Linear
regression: It is a linear approach for modelling relationship between
target variable and other attributes in the data set. This model can be used to
predict numeric values when the attributes are not perfectly correlated.
4.
Random
forest classification: It can ensemble learning method that constructs
multiple decision trees and outputs the value that collectively represents all
the decision trees. It can predict both numeric and categorical variables.


è
Click on ok.
è
Click on select column and select the data
column to analyse.
è
Click on save. And finally Run Data Flow.

Train
Multi-Classifier Model: Apply this model to classify your data into
three or more predefined categories.
Example:
you may predict pic of fruits is apples, orange or banana
We train binary classification using the
train Multi classification step by step:
è
Create or open data flow.
è
Click on add step (+), then click on Train
Binary Classification.
è
In the select Train Multi-Classification model
script dialog, select script
1.
CART
(Classification and Regression Tree) for model training: Uses decision tree to predict both discrete
and continue values. It can be used when working with large datasets.
2.
Naive
Bayes for classification: Is a probabilistic classification based on Bayes’
theorem with assumption that there is no dependent between features. It is used
in when they are high number of input dimensions.
3.
Neural
network for classification: Is an iterative classification algorithm that
learns by comparing its classification results with the actual value and
feedback it to the network to modify the algorithm for further iterations. This
is used for text analysis.
4.
Random
forest for model classification: Is ensemble learning method that
constructs multiple decisions trees and outputs the values that collectively
represents all the decision trees. It can be used to predict both numeric and
categorical variables.
5.
SVM
(support vector machine) for classification: It classifies vectors by
mapping them in space and constructing hyper planes which can be used for
classification. New records (scrolling data) are then mapped onto the space and
are predicted belong to category based on which side on hyper planes they fall.


è
Click on ok.
è
Click on select column and select the data
column to analyse.

è
Click on save. And finally Run Data Flow.
Train Binary Classification: To predict attrition have two values yes/no.
Train Binary Classification: To predict attrition have two values yes/no.
Apply Binary classification model to
classify your data into one of two predefined categories.
Example: you might predict whether product
instance will pass or fail to quality control test.
We train binary classification using the
train binary classification step by step:
è
Create or open data flow.
è
Click on add step (+), then click on Train
Binary Classification.
è
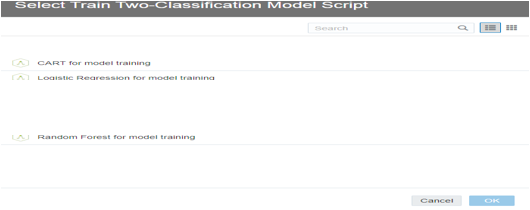
In the select Train Two-classification model
script dialog, select script
1.
CART (Classification and Regression Tree) for
model training.
2.
Logistic regression algorithm.
3.
SVM (support vector machine) for classification.
4.
Naive Bayes for classification.
5.
Neural network for classification.
6.
Random forest for model classification.

è
Click on ok.
è
Click on select column and select the data
column to analyse.

è
Click on save. And finally Run Data Flow.
Train Clustering: Apply this model to identifying the similar records assign them into one cluster.
Train Clustering: Apply this model to identifying the similar records assign them into one cluster.
We train binary classification using the
Train Clustering step by step:
è
Create or open data flow.
è
Click on add step (+), then click on Train Clustering.
è
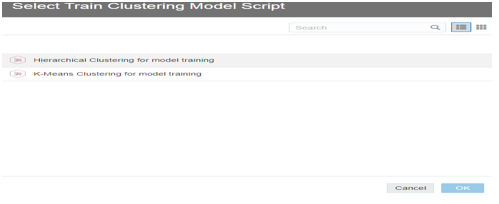
In the select Train Clustering model script
dialog, select script
1.
Hierarchical
Clustering for Classification: It builds a hierarchy of clusters using
either bottom-up of top-bottom. Hierarchical clustering is usually used when
the data set is not big and number of clusters in not known beforehand.
2.
K-Means Clustering
for Classification: It is iteratively partition records into k clusters in
which each observation belongs the cluster with nearest means. It can be used
for clustering metric columns and with a set expectations of number of clusters
needed. it is known to work well with the large data sets. Results will also be
different with each run unlike hierarchical clustering.

è
Click on ok.
è
Click on save. And finally Run Data Flow.
After created model then we can viewed or accessed in Machine Learning Tab.
After created model then we can viewed or accessed in Machine Learning Tab.


To view more details about each model quality, like
Accuracy, Confusion Matrix etc., inspect the model.

In that we can see the quality tab for the
model. You will found the model quality details like below:

No comments:
Post a Comment